Sequence Alignments
Dotplots
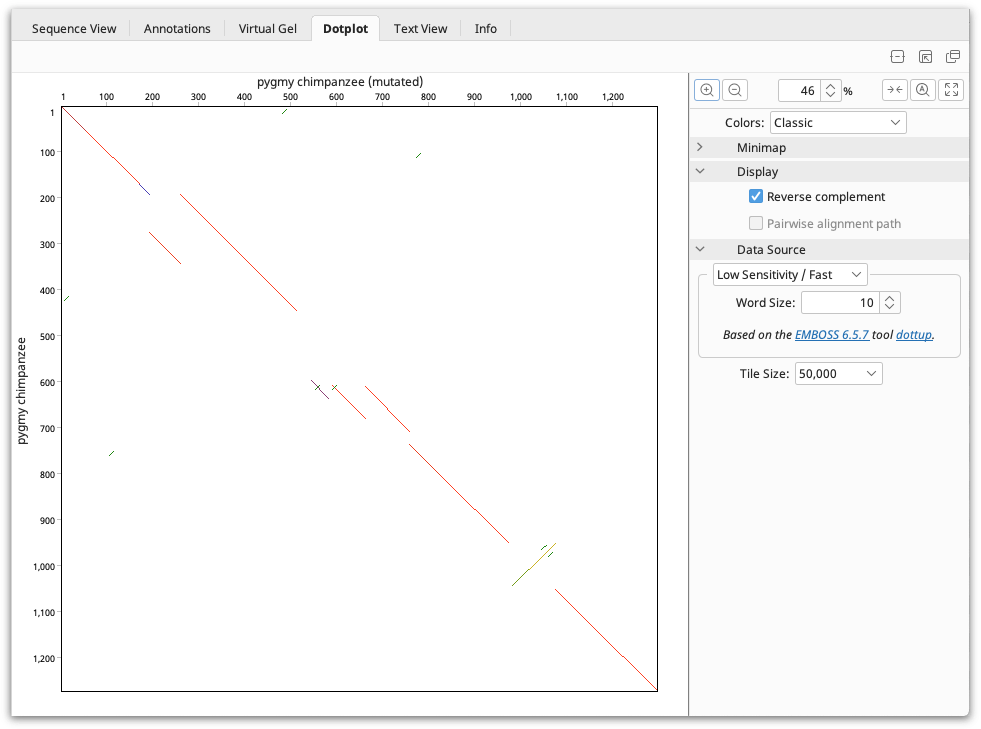
A dotplot compares two sequences against each other and helps identify similar regions. Using this tool, it can be determined whether a similarity between the two sequences is global (present from start to end) or local (present in patches).
To view a dotplot select two nucleotide or protein sequences in the Document Table and select Dotplot in the tab above the sequence viewer.
Note that if a single nucleotide or protein sequence is selected then the dotplot tab will not be shown. If you wish to view a dotplot showing a comparison of the sequence to itself then go menu Tools → Appearance and Behavior and check the option to Show Dotplot view on single sequences (compare to self). A Dotplot (Self) Tab will then be visible in the Document viewer pane.
The Geneious dotplot offers two different comparison engines based on the EMBOSS dottup and dotmatcher programs. You can choose which program to use by setting the sensitivity under Data Source, the panel to the right of the dot plot. The Low Sensitivity/Fast setting uses dottup, and the High Sensitivity/Slow setting uses dotmatcher. More information on these programs can be found by going to http://emboss.sourceforge.net.
The dotplot is drawn from top-left to bottom-right. The Minimap in the panel to the right of the viewer aids navigation of large dotplots by showing the overall comparison and a box indicating where the dotplot window sits.
The Colors for the Dotplot can be selected at the top of the settings panel. The Classic scheme will color the dot plot lines according to the length of the match, from blue for short matches, to red for matches over 100 bp long.
For nucleotide comparisons, the reverse complement can also be viewed, where matches with one of the sequences reverse complemented are displayed. These matches are shown by lines running from the bottom left to top right. When a pairwise alignment is selected, the path that the alignment takes through the dot plot can be displayed by checking Pairwise alignment path. This is shown as a light blue line running through the dot plot. Both of these options can be found under the Display section.
Interpreting a Dotplot
-
Each axis of the plot represents a sequence.
-
A long, largely continuous, diagonal indicates that the sequences are related along their entire length.
-
Sequences with some limited regions of similarity will display short stretches of diagonal lines.
-
Diagonals on either side of the main diagonal indicate repeat regions caused by duplication.
-
A random scattering of dots reflects a lack of significant similarity. These dots are caused by short sub-sequences that match by chance alone.
For more information on dotplots, refer to the paper by Maizel and Lenk 1981.
Sequence Alignments
Over evolutionary time, related DNA or amino acid sequences diverge through the accumulation of mutation events such as nucleotide or amino acid substitutions, insertions and deletions.
A sequence alignment is an attempt to determine regions of homology in a set of sequences. It consists of a table with one sequence per row, and with each column containing homologous residues from the different sequences, e.g. residues that are thought to have evolved from a common ancestral nucleotide/amino acid. If it is thought that the ancestral nucleotide/amino acid got lost on the evolutionary path to one descendant sequence, this sequence will show a special gap character "-" in that alignment column.
Pairwise sequence alignments
There are two types of pairwise alignments: local and global alignments.
A local alignment is an alignment of two sub-regions of a pair of sequences. This type of alignment is appropriate when aligning two segments of genomic DNA that may have local regions of similarity embedded in a background of a non-homologous sequence.
A global alignment is a sequence alignment over the entire length of two or more nucleic acid or protein sequences. In a global alignment, the sequences are assumed to be homologous along their entire length.
Scoring systems in pairwise alignments
In order to align a pair of sequences, a scoring system is required to score matches and mismatches. The scoring system can be as simple as "+1" for a match and "-1" for a mismatch between the pair of sequences at any given site of comparison. However substitutions, insertions and deletions occur at different rates over evolutionary time. This variation in rates is the result of a large number of factors, including the mutation process, genetic drift and natural selection. For protein sequences, the relative rates of different substitutions can be empirically determined by comparing a large number of related sequences. These empirical measurements can then form the basis of a scoring system for aligning subsequent sequences. Many scoring systems have been developed in this way. These matrices incorporate the evolutionary preferences for certain substitutions over other kinds of substitutions in the form of log-odd scores. Popular matrices used for protein alignments are BLOSUM and PAM matrices.
Note: The BLOSUM and PAM matrices are substitution matrices. The number of a BLOSUM matrix indicates the threshold (%) similarity between the sequences originally used to create the matrix. BLOSUM matrices with higher numbers are more suitable for aligning closely related sequences. For PAM, the lower numbered tables are for closely related sequences and higher numbered PAMs are for more distant groups. See Trivedi and Nagarajaram 2020 for a review.
When aligning protein sequences in Geneious, a number of BLOSUM and PAM matrices are available.
Algorithms for pairwise alignments
Once a scoring system has been chosen, we need an algorithm to find the optimal alignment of two sequences. This is done by inserting gaps in order to maximize the alignment score. If the sequences are related along their entire sequence, a global alignment is appropriate. However, if the relatedness of the sequences is unknown or they are expected to share only small regions of similarity, (such as a common domain) then a local alignment is more appropriate.
An efficient algorithm for global alignment was described by Needleman and Wunsch 1970, and their algorithms was later extended by Gotoh 1982 to model gaps more accurately. For local alignments, the Smith-Waterman algorithm is the most commonly used. See the references at the links provided for further information on these algorithms.
Pairwise alignment with the Geneious aligner
Like a dot plot, a pairwise alignment is comparison between two sequences with the aim of identifying which regions of two sequences are related by common ancestry and which regions of the sequences have been subjected to insertions, deletions, and substitutions.
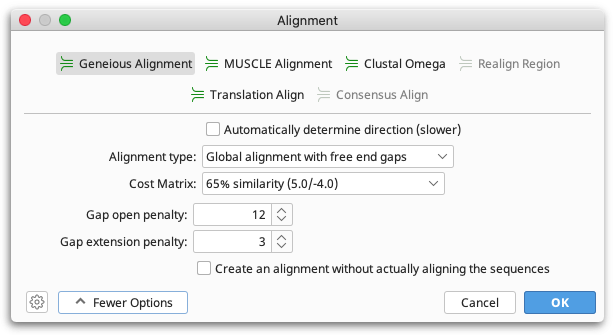
To run a pairwise alignment using the Geneious aligner, select the two sequences you wish to align and choose Align/Assemble → Pairwise align.... The options available for the alignment cost matrix will depend on the kind of sequence.
-
Protein sequences have a choice of PAM and BLOSUM matrices.
-
Nucleotide sequences have choices for a pair of match/mismatch costs. Some scores distinguish between two types of mismatches: transition and transversion. Transitions (A ↔ G, C ↔ T) generally occur more frequently than transversions. Differences in the ratio of transversions and transversions result in various models of substitution. When applicable, Geneious indicates the target sequence similarity for the alignment scores, i.e. the amount of similarity between the sequences for which those scores are optimal.
-
Both protein and nucleotide pairwise alignments have choices for gap open / gap extension penalties/costs. Unlike many alignment programs these values are not restricted to integers in Geneious.
The score of a pairwise alignment is:
matchCount x matchCost + mismatchCount x mismatchCost
For each gap of length n, a score of gapOpenPenalty + (n - 1) x gapExtensionPenalty is subtracted from this.
Where
-
gapOpenPenalty= The "gap open penalty" setting in Geneious. -
gapExtensionPenalty= The "gap extension penalty" setting in Geneious. -
matchCost= The first number in the Geneious cost matrix. -
mismatchCost= The second number in the Geneious cost matrix. -
matchCount= The number of matching residues in the alignment. -
mismatchCount= The number of mismatched residues in the alignment.
When doing a Global alignment with free end gaps, gaps at either end of the alignment are not penalized when determining the optimal alignment. This is especially useful if you are aligning sequence fragments that overlap slightly in their starting and ending positions, e.g. when using two slightly different primer pairs to extract related sequence fragments from different samples. You can also do a Local Alignment if you want to allow free end overlaps, rather than just free end gaps in one alignment.
Multiple sequence alignments
A multiple sequence alignment is a comparison of multiple related DNA or amino acid sequences. A multiple sequence alignment can be used for many purposes including inferring the presence of ancestral relationships between the sequences. It should be noted that protein sequences that are structurally very similar can be evolutionarily distant. This is referred to as distant homology. While handling protein sequences, it is important to be able to tell what a multiple sequence alignment means - both structurally and evolutionarily. It is not always possible to clearly identify structurally or evolutionarily homologous positions and create a single "correct" multiple sequence alignment (Durbin et al 1998).
Multiple sequence alignments can be done by hand but this requires expert knowledge of molecular sequence evolution and experience in the field. Hence the need for automatic multiple sequence alignments based on objective criteria. One way to score such an alignment would be to use a probabilistic model of sequence evolution and select the alignment that is most probable given the model of evolution. While this is an attractive option there are no efficient algorithms for doing this currently available. However a number of useful heuristic algorithms for multiple sequence alignment do exist.
Progressive pairwise alignment methods
The most popular and time-efficient method of multiple sequence alignment is progressive pairwise alignment. The idea is very simple. At each step, a pairwise alignment is performed. In the first step, two sequences are selected and aligned. The pairwise alignment is added to the mix and the two sequences are removed. In subsequent steps, one of three things can happen:
-
Another pair of sequences is aligned
-
A sequence is aligned with one of the intermediate alignments
-
A pair of intermediate alignments is aligned
This process is repeated until a single alignment containing all of the sequences remains. Feng & Doolittle were the first to describe progressive pairwise alignment. Their algorithm used a guide tree to choose which pair of sequences/alignments to align at each step. Many variations of the progressive pairwise alignment algorithm exist, including the one used in the popular alignment software ClustalX.
Multiple sequence alignment using the Geneious aligner
To run a multiple alignment using the Geneious aligner, select all the sequences you wish to align and click Align/Assemble →Multiple align.... Select Geneious as the alignment algorithm.
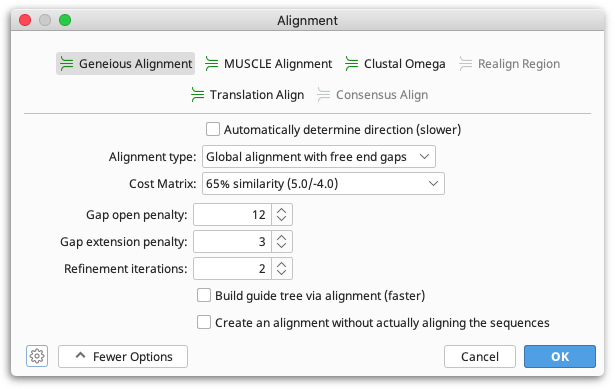
The Geneious multiple alignment algorithm uses progressive pairwise alignment. The neighbor-joining method of tree building is used to create the guide tree.
As progressive pairwise alignment proceeds via a series of pairwise alignments, this function has all the standard pairwise alignment options, plus the option of refining the multiple sequence alignment once it is done. "Refining" an alignment involves removing sequences from the alignment one at a time, and then realigning the removed sequence to a "profile" of the remaining sequences. The number of times each sequence is re-aligned is determined by the refinement iterations option in the multiple alignment window. The resulting alignment is placed in the folder containing the original sequences.
A profile is a matrix of numbers representing the proportion of symbols (nucleotide or amino acid) at each position in an alignment. This can then be pairwise aligned to another sequence or alignment profile. When pairwise aligning profiles, mismatch costs are weighted proportional to the fraction of mismatching bases and gap introduction and gap extension costs are proportionally reduced at sites where the other profile contains some gaps.
In some cases building a guide tree can take a long time since it requires making a pairwise alignment between each pair of sequences. The build guide tree via alignment option may speed this part by taking a different route. First make a progressive multiple alignment using a random ordering, and use that alignment to build the guide tree. Notice that while this usually speeds up the process, it may not if the sequences are very distant genetically.
You can also do a multiple alignment via translation and back, as with pairwise alignment (see Translation Alignment).
Sequence alignment using Clustal Omega
Note: Clustal Omega replaces ClustalW in Geneious Prime 2020 onwards
Clustal Omega is a general purpose multiple sequence alignment (MSA) program for protein and DNA/RNA. It produces high quality MSAs and uses multiple execution threads, so is capable of handling datasets of hundreds of thousands of sequences in reasonable time. Clustal Omega can be run from within Geneious Prime without having to export your sequences and can also be used with translation alignment.
To perform an alignment using Clustal Omega, select the sequences or alignment you wish to align, then select Align/Assemble → Multiple Align.... Select Clustal Omega as the alignment type, and the options available for a Clustal Omega alignment will be displayed.
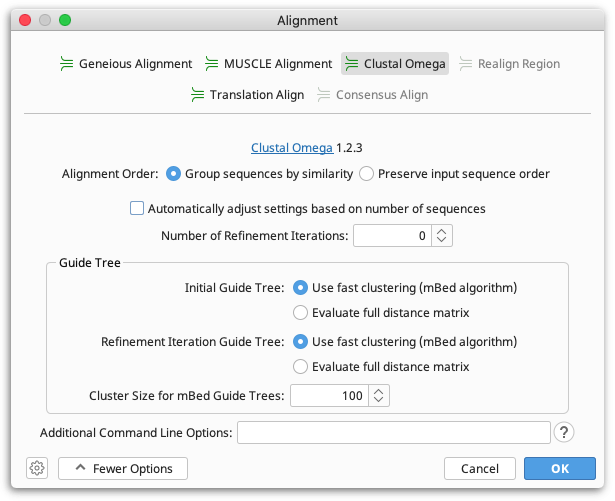
To have Clustal Omega automatically select the speed and accuracy settings based on the size of your dataset, open the More Options tab and select Automatically adjust settings based on number of sequences.
For further information on the Clustal Omega settings and additional command line options, see the Clustal Omega documentation. The command line input and output for your alignment can be viewed in the Info tab on the alignment result document in Geneious.
Sequence alignment using MUSCLE
MUSCLE is public domain multiple alignment software for protein and nucleotide sequences. MUSCLE stands for multiple sequence comparison by log-expectation.
To perform an alignment using MUSCLE, select the sequences or alignment you wish to align and select Align/Assemble → Multiple Align.... Select MUSCLE as the alignment type, and the options available for a MUSCLE alignment will be displayed.
For more information on muscle and its options, please refer to the original documentation for the program: http://www.drive5.com/muscle/muscle.html.
Other sequence alignment plugins for Geneious Prime
MAFFT
MAFFT (Multiple Alignment using Fast Fourier Transform) is a fast multiple alignment program suitable for large alignments. To use MAFFT, you must first download the plugin by going to Plugins under the Tools menu and selecting MAFFT Multiple Alignment from the list of available plugins. Click the Install button to install it, and then click OK to close the Plugins window. To run MAFFT, select the sequences or alignment you wish to align, select the Align/Assemble button from the Toolbar and choose Multiple Alignment. MAFFT should now be showing as an option for the type of alignment.
For more information on MAFFT and its options, please refer to the original documentation for the program: http://mafft.cbrc.jp/alignment/software/.
Mauve
The Mauve aligner allows you to construct whole genome multiple alignments in the presence of large-scale evolutionary events such as rearrangement and inversion. To use Mauve, you must first download the plugin by going to Plugins under the Tools menu and selecting Mauve from the list of available plugins. Click the Install button to install it, and then click OK to close the Plugins window. To run Mauve, select the sequences or alignment you wish to align, select the Align/Assemble button from the Toolbar and choose Align Whole Genomes.
An alignment produced by Mauve is displayed in the Mauve genome alignment viewer, which allows you to easy see aligned blocks of sequence and genome rearrangements. Note that this is not a regular Geneious alignment document and you cannot run downstream analyses such as tree building from this document. To run downstream analyses you must first extract the local alignment blocks. To do this, switch to the Alignment View tab above the sequence viewer and if you have more than one local alignment block, choose which one you wish to extract in the General tab to the right of the sequence viewer. Then select all the sequences in that alignment and click Extract. Choose the option to extract the sequences as an alignment, and a separate alignment document will be created in the document table.
For more information on Mauve and its options, please refer to the original documentation for the program: http://darlinglab.org/mauve/mauve.html.
LASTZ
LASTZ is designed for pairwise alignments of whole genomes and can efficiently align chromosomal or genomic sequences millions of nucleotides in length. To use LASTZ, you must first download the plugin by going to Plugins under the Tools menu and selecting LASTZ from the list of available plugins. Click the Install button to install it, and then click OK to close the Plugins window. To run LASTZ, select the sequences or alignment you wish to align, select the Align/Assemble button from the Toolbar and choose Align Whole Genomes.
For more information on LASTZ and its options, please refer to the original documentation for the program: http://www.bx.psu.edu/~rsharris/lastz/
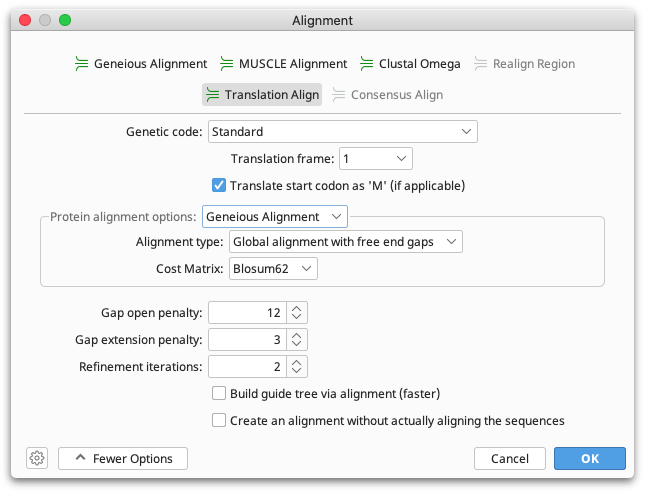
Translation alignment
In a translation alignment, nucleotide sequences are translated into protein, the alignment is performed on the protein sequence, and then translated back to nucleotide sequence. Translation alignments can be performed with any of the alignment algorithms in Geneious Prime, such as the Geneious aligner, MUSCLE or Clustal Omega.
In the translation alignment options you can set the genetic code and translation frame for the translation as well as the alignment algorithm you wish to use. All sequences in the alignment must use the same translation frame. Under More Options you can set the parameters such as cost matrix, gap open penalty and gap extension penalty for the alignment.
Combining alignments and adding sequences to alignments
Consensus Alignment allows you to align two or more alignments together (and create a single alignment) and align a new sequence in to an existing alignment. Select the sequences or alignment you wish to align and select the Align/Assemble button from the Toolbar and choose Multiple Alignment. Consensus alignment allows you to choose which alignment algorithm to use for aligning the consensus sequences. All of the pairwise and multiple alignment algorithms are available. The consensus sequence used for each alignment is a 100% consensus with gaps ignored.
For information on concatenating alignments, see section Concatenating Sequences.
Alignment viewing and editing
Alignments are displayed in the viewer below the document table, in the same way as individual sequences. See The Sequence Viewer for details on controls such as zooming in and out, wrapping sequences, setting colors, and selecting individual or multiple sequences from an alignment. For a description of alignment statistics available in the Statistics tab, see Statistics.
To edit an alignment, you must first click the Allow Editing button on the toolbar above the sequence viewer. Alignments are edited in the same way as for individual sequences - for details on editing operations and shortcut keys, see Editing Sequences. If the consensus sequence of an alignment or assembly is edited, the changes are applied to all sequences in the alignment, with the exception of the reference sequence.
Highlighting
Identical or variable sites in an alignment can be highlighted by checking the Highlighting option under the  Display tab.
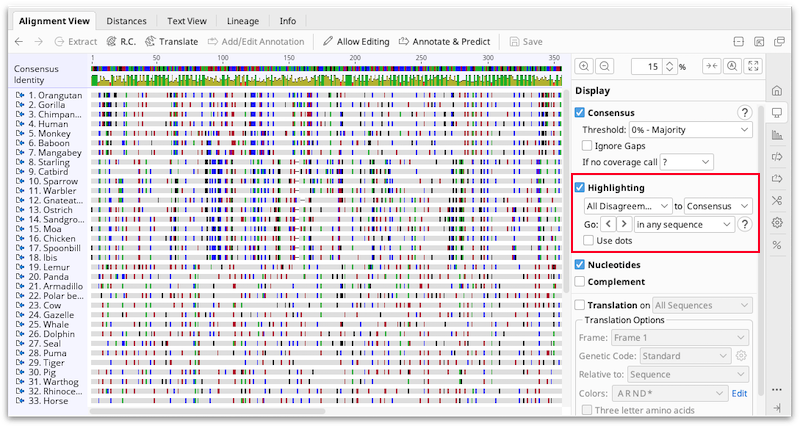
The drop down menus allow you to choose what to highlight, and whether the consensus or reference sequence should be used for the comparison. The options for what to highlight are:
-
Agreements: Greys out residues that are not identical to the consensus or reference allowing you to quickly locate conserved sites in the alignments.
-
Disagreements: This greys out residues that are identical to the consensus or reference in that column, allowing you to quickly locate variable sites in the alignment. Ambiguous disagreements (e.g. G vs N for nucleotides) are also greyed out and not highlighted.
-
All Disagreements: This greys out residues that are identical to the consensus or reference in that column, allowing you to quickly locate variable sites in the alignment. Ambiguous disagreements (e.g. G vs N for nucleotides) will not be greyed out, so will appear highlighted.
-
Ambiguities: Greys out non-ambiguous residues.
-
Gaps: Greys out non-gap positions.
-
Transitions/transversions: Greys out residues that are not transitions/transversions compared to the consensus or reference sequence. When highlighting transitions/transversions, it is recommended you turn on the ignore gaps consensus option or some residues may be wrongly highlighted due to the consensus displaying N for sites that contain gaps and non-gaps.
The Go < > arrows allow you to navigate forwards and backwards between highlighted features. Where there are more than two consecutive highlights within a sequence the selection will only stop on the first and last of these. Using the drop down menu, you can choose to navigate between highlighted features in any sequence, in the current sequence, in a different column, or the reference/consensus sequence.
When clicking the arrows:
-
hold down alt to go to highlighted features in the consensus or reference sequence only.
-
hold down ctrl (command) to go to highlighted features that aren't in the consensus or reference sequence.
-
hold down ctrl (command) and alt to go to highlighted features in the currently selected sequence.
These actions may also be accessed directly using specific shortcuts which can be configured from Tools → Preferences → Keyboard. Using a keyboard shortcut or modifier key will override what is set in the drop down menu.
Default Shortcuts (mac keys in brackets):
-
ctrl+D (command+D): Go to next highlighted feature
-
ctrl+shift+D (command+shift+D): Go to previous highlighted feature
-
ctrl+alt+D (ctrl+option+command+D): Go to next highlighted feature in consensus or reference sequence only
-
ctrl+alt+shift+D (ctrl+option+shift+command+D): Go to previous highlighted feature in consensus or reference sequence only
If Use dots is checked, non-highlighted residues are displayed as dots instead of being greyed out.
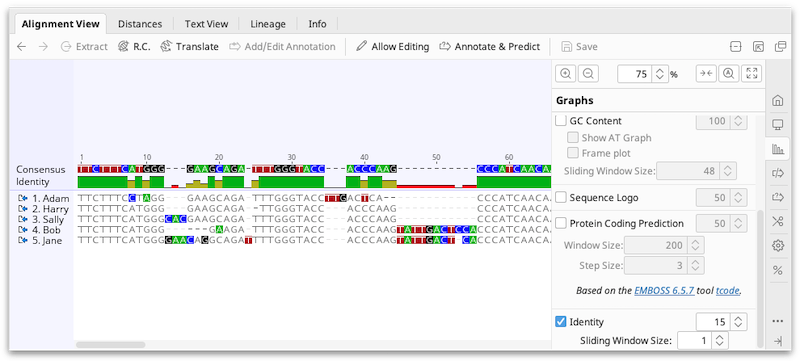
Alignment viewer graphs
Alignment graphs can be toggled on or off in the  Graphs tab to the right of the viewer.
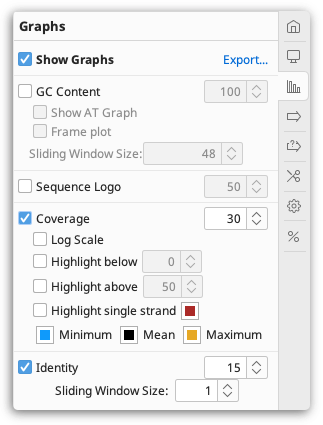
In addition to the basic graphs available for individual sequences, the following graphs are available for alignments and assemblies:
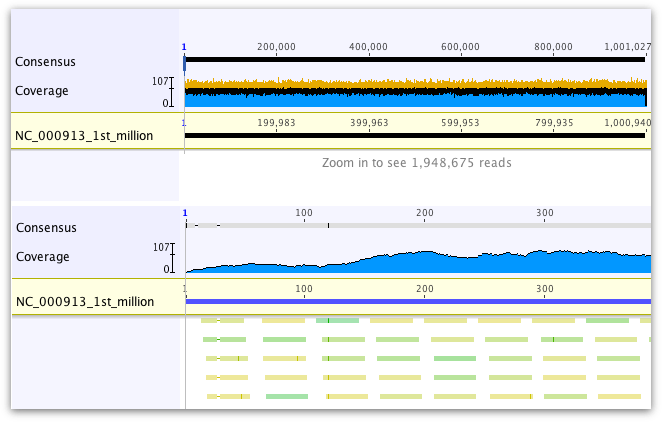
Coverage Graph
The height of the graph at each position represents the number of sequences which have a non-gap character at that position. The coverage graph is made up of three bar graphs overlaid on each other: a blue graph shows the minimum coverage, a black graph shows the mean coverage and a yellow graph (underneath the blue and black graphs) shows the maximum coverage. The minimum graph is drawn over the top of the mean color graph, but if necessary the minimum color graph will be reduced in height so that a single pixel of the mean color graph is always visible at each position. Thus, for sequences which are zoomed in so that the horizontal width of each site is one pixel or more, then the graph will be shown in blue with a black line across the top, denoting the coverage at that position. For large alignments which are zoomed out so that the horizontal width of each site is less than one pixel (i.e. each pixel represents more than one site in the alignment), all three bars are visible, showing the minimum, mean and maximum coverage of bases within that pixel.
To highlight regions above or below a particular coverage level, open the Graphs tab and check Highlight above... or Highlight below... and a bar will appear below the coverage graph across regions which fit these criteria. The "Highlight above" bar is blue, and the "Highlight below" bar is yellow. Regions where the alignment or assembly is made up of sequences in a single direction (e.g. forward or reverse sequences only) can be highlighted by checking Highlight single strand.
The scale bar to the left of the graph shows minimum and maximum coverage for the entire alignment or assembly, as well as a tick somewhere in between for the mean coverage.
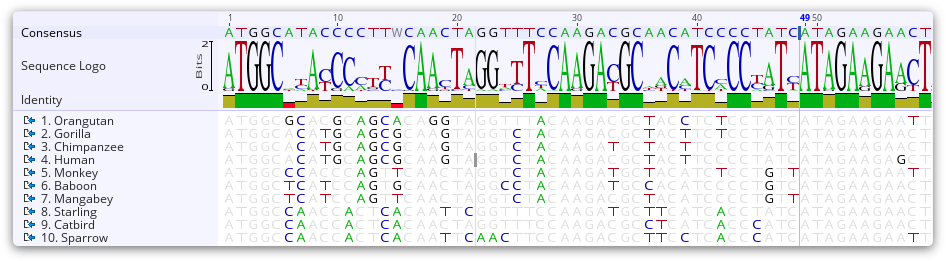
Sequence Logo
This displays a sequence logo, where the height of the logo at each site is equal to the total information at that site, and the height of each symbol in the logo is proportional to its contribution to the information content. When weight by quality is enabled, the height of the sequence logo is proportional to the quality score at that site, which is useful for identifying low quality regions and resolving conflicts. When the sequence is zoomed out far enough such that the horizontal width of each base is less than one pixel, then the height is the average of the information over multiple sites. When gaps occur at at some sites, the height is scaled down further to be proportional in height to the number of non-gap residues.
On large contigs (over 100,000 bp long), the sequence logo can't be efficiently calculated in regions of over 1000 fold coverage, in which case the sequence logo will display ?.
Identity Graph
This displays the identity across all sequences for every position. Green means that the residue at the position is the same across all sequences. Sites with 30% to under 100% identity are yellow, and sites with less than 30% identity are red.
Alignment masking
To mask or strip columns from your alignment, go to Tools → Mask Alignment...
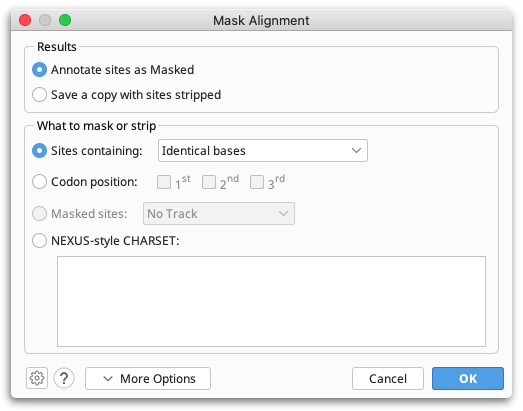
This tool can be used to add "Masked" annotations to sites or to create a copy of your alignment with some sites removed. Sites can be removed or masked by sequence content (e.g., you can remove all gaps, or all constant sites), codon position, existing Masked annotations, or using a NEXUS-style CHARSET. For the purposes of phylogenetic analyses, you can use this tool to create alignments from which any sites with Masked-type annotations will be removed (see Using alignment masks).
Masking sites by sequence content:
Sites can be masked or stripped based on the following sequence content:
-
Identical residues: Masks or strips all sites that are constant (those sites containing the same residues or sites consisting entirely of gaps).
-
All gaps: Masks or strips all sites containing only gaps. Sites containing gaps as well as residues will be preserved.
-
Gaps (%): Masks or strips all sites containing at least the specified percentage of gaps (inclusive). Sites containing less than this percentage of gaps will be preserved.
-
Any gaps: Masks or strips all sites containing at least one gap.
-
Ambiguities: Masks or strips all sites containing at least one ambiguity.
When deciding whether or not to remove a site, regions annotated as Trimmed will not be considered.
Mask sites by codon position:
1st, 2nd and/or 3rd codon positions can be masked or stripped by checking the codon positions that you do not want to analyze. Note that this option always takes the first base in your alignment to be codon position one, regardless of any ORF or CDS annotations that may be on your sequences. Available for nucleotide sequences only.
Remove masked sites:
If you already have an annotation track on your sequence containing Masked annotations, then you can strip these regions by choosing the "masked sites" option and the track you wish to use. Only masks applied to the consensus sequence of an alignment are used for stripping.
Mask sites defined by a NEXUS-style CHARSET:
Sites can be masked or stripped based on a NEXUS-style CHARSET entered into the text area. This must conform to the NEXUS CHARSET specifications (see Maddison, Swofford & Maddison 1997). Both standard or vector style CHARSETs can be used.
For example, both of the following would mask or strip sites 2, 4, 5, and 6 from an alignment with 10 sites.
Standard style: 2 4-6
Vector style: 0101110000
Consensus sequences
To display a consensus sequence on your alignment, check the Consensus option under the Display tab.
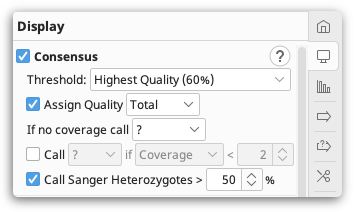
The consensus sequence is displayed above the alignment or assembly, and shows which residues are conserved (are always the same), and which residues are variable. A consensus is constructed from the most frequent residues at each site (alignment column), so that the total fraction of rows represented by the selected residues in that column reaches at least a specified threshold.
To work with the consensus sequence in a downstream analysis, you must first Extract it from your alignment. To do this, click on Consensus to select the entire sequence, then click Extract to extract it to a new sequence document. Alternatively, go to Tools → Generate Consensus Sequence. This operation allows you to choose the options for how your consensus sequence is called (as described below), and then saves it to a separate document. If your consensus sequence contains '?' characters where there are regions with no or low coverage in your assembly, you can split the consensus sequence at these bases to generate multiple sequences by checking the option to Split into separate sequences around '?' calls.
Threshold settings
The Threshold determines which base in called in the consensus, and can be set to a percentage, or by using the quality scores on the reads. IUPAC ambiguity codes (such as R for an A or G nucleotide) are counted as fractional support for each nucleotide in the ambiguity set (A and G, in this case), thus two rows with R are counted the same as one row with A and one row with G. When more than one nucleotide is necessary to reach the desired threshold, this is represented by the best-fit ambiguity symbol in the consensus; for protein sequences, this will always be an X.
For example, assume a column contains 6 A's, 3 G's and 1 T. If the consensus threshold is set to 60% or below, then the consensus will be A. If the consensus threshold is set to between 60% and 90%, then the consensus will be R. If the consensus threshold is set to over 90%, then the consensus will be D.
In the case of ties, either all or none of the involved residues will be selected. For example, if the above case instead had 6 A's, 2 G's and 2 T's, then for a consensus threshold of 60% or below, an A will be called. Above a threshold of 60%, a D will be called.
When the aligned sequences contain quality information in the form of chromatograms or fastq data, you can select Highest Quality to calculate a majority consensus that takes the relative residue quality into account. This sums the total quality for each potential base call, and if the total for a base exceeds 60% of the total quality for all bases, then that base is called. Highest Quality (Raw) uses the raw chromatogram scores.
When Highest Quality (50% or 60% or 75%) consensus calling is selected, in order to improve consensus accuracy, Geneious will adjust the value of the raw quality scores that contribute to consensus calling such that
-
Homopolymer regions are made symmetric using the lower of the two quality scores. For example if there are 3 consecutive G's with quality scores of 14, 12, 10, these will be replaced with quality scores of 10, 12, 10 to reflect that the confidence that the first position is a G is the same as the confidence that the last position is a G. This is important for an alignment against another sequence where there are only two G's where it is equally valid to position the gap before the first G or after the last G.
-
Low quality gaps (under quality 30) have their quality scores up to halved so that consensus calling is not biased towards the sequence with a shorter version of a homopolymer. For example if NA-N (the A has quality 20) is aligned to NAAN (the 2 As have quality 10 because of the lower confidence that this homopolymer is 2 bp long), then the gap which would normally be assigned a quality score of 20 (assuming the nearby N has a higher quality), will have it's quality score halved so that it will be comparable to the quality scores in the other sequence.
-
For Sanger traces, gap quality scores take on the minimum quality score of the two previous and two next homopolymers. For example G--AAA---CCT the quality of the 3 gaps is the minimum quality of the G, the two outer A's, the C's and the T. This is because in an equally good alignment the C's or A's could be shifted into this gap, so the gap could be between the G/A or C/T instead.
-
For Sanger traces, traces are analyzed and the quality score is reduced if the called peak is not an obvious peak or if there is an alternative peak over 50% of the height of the called peak.
Assigning quality to the consensus
The Assign Quality setting enables you to map the quality of the sequences onto the consensus. Choose Highest to map the quality of the highest quality base at each column onto the consensus. Select Total to map the sum of the contributing bases, minus the sum of the non-contributing bases.
For example: if there are two G's and three A's in a column, with the G's having qualities of 16 and 24, and the A's having qualities of 40, 42, and 50 respectively, then because (40+42+50) > 60% of (40+42+50+16+24), an A will be called for the consensus. This consensus A will have a quality of (40+42+50)-(16+24)=92 if using Total, or 50 if using Highest.
A more complicated example for Highest Quality consensus calling using Total: Assume a column contains 2 A's with qualities of 30 and 25, 1 G with quality 30 and 1 T with quality 15. Because the total qualities of the A's is 55 out of 100 for the column, this is not higher than the 60% threshold to call an A. With the G included, the total quality is 30 + 25 + 30 = 85, which is higher than the 60% threshold, so a consensus call of R will be made. The quality assigned to this R will be the sum of the bases that agree with the consensus call minus the bases that disagree, which is 30 + 25 + 30 - 15 = 70.
When reads have mapping qualities (confidence that the entire read is mapped to the correct location), the mapping quality is combined with the base pair quality to form the quality used during consensus calling. The log scale qualities are combined as probabilities so a very rough rule of thumb is the combined quality will be approximately equal to the minimum of the mapping quality and base call quality, except in cases where the two values are very close in which case the combined quality will be slightly smaller.
Gaps are treated just like a standard base and are assigned a quality score equal to half the minimum base call quality on either side of the gap.
For example, if a column has a C with quality 41 and mapping quality 3, a gap with adjacent base calls of quality 41 and 30 with mapping quality 240, and a C with quality 41 and mapping quality 20. The two C's will have combined quality scores of approximately 3 and 20 respectively. The gap will have an effective combined quality score of 30 / 2 = 15. So the consensus call will be a C with quality 20 + 3 - 15 = 8.
Other settings
Ignore Gaps (alignment documents only): When this is checked, the consensus is calculated as if each alignment column consisted only of the non-gap characters; otherwise, the gap character is treated like a normal residue, but mixing a gap with any other residue in the consensus always produces the total ambiguity symbol (N and X for nucleotides and amino acids, respectively).
If no coverage call: For alignments or contigs with a reference sequence, this setting can be used to control what character the consensus sequence should use when the reference sequence has no coverage. Options available are - , X/N, ? or Ref. A '?' represents an unknown character, potentially a gap. If Ref is selected, then the consensus is assigned whatever character the reference sequence has at that position. Note that if any sequence in the alignment/contig has an internal gap in it, that is still considered valid coverage at that position, and this setting will not apply.
Call N if Quality below: Enables you to change consensus bases to N's if the quality is below the threshold that you set. This is particularly useful for exporting sequences to file formats which do not preserve quality (for example FASTA).
Call Sanger Heterozygotes (choromatogram assemblies only): When a Sanger trace has an alternative peak that is at least as high as the specified percentage of the best peak, that trace will contribute a heterozygous call to the consensus calculation. Base calls with a quality score of at least 63 (i.e those manually edited) will not be analyzed for heterozygotes.