CRISPR
CRISPR site finder
The CRISPR system is an RNA-guided endonuclease technology for gene editing. This system uses a guide RNA (gRNA) of around 20 bp, next to an enzyme-specific PAM (Protospacer Adjacent Motif), to direct the enzyme complex to the cleavage site. The Find CRISPR Sites tool searches for gRNA ("CRISPR") sites in your selected sequences, and scores them based on on-target sequence features and off-target interactions.
Find CRISPR Sites can be run on any number of sequences and sequence list documents, including on selections within the documents. For best performance the target sequence for each document should be limited to 1000 bp.
To use the tool, select your target sequences and click Find CRISPR Sites in the Annotate and Predict menu. Check Anywhere in sequence or Selected region depending on whether you are using a selection or not, and choose the PAM Site Location (see below). Enter the Target and PAM Site motifs you want to search for in the CRISPR site panel (for syntax help, hit the help button to the top right of the panel). You can then select your scoring and pairing options and hit OK. Any CRISPR sites found will be annotated back on to your original sequences, with the associated scores listed in the label on the CRISPR annotation.
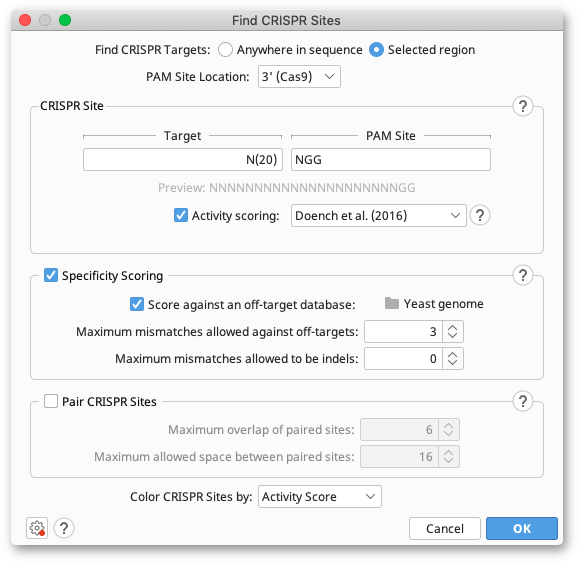
PAM Site Location
Different CRISPR enzymes recognize different PAM site motifs. The CRISPR-Cas9 family recognizes PAM Sites on the 3′ end of the guide sequence, but the more recently discovered CRISPR-Cpf1 enzymes (Zhang et al. (2016)) recognize a 5′ PAM site. Change the PAM Site location option to match the orientation of the enzyme you are using. Note that activity (on-target) scoring methods for Cpf1 sites are not currently available. If you have a particular scoring method you would like to use for Cpf1, please contact Support.
Activity Scoring
Activity, or on-target scoring looks at the sequence features of the CRISPR site itself, and compares them to an experimentally determined model. The model then scores the site based on its predicted level of activity.
Geneious Prime offers activity scoring for Cas9 CRISPR sites using the methods from Doench et al. (2014) and Doench et al. (2016). The Doench et al. (2014) method analyzes the one- and two-base features of the gRNA, as well as the GC content, to generate the score. Scores are between 0 and 1, with a higher score denoting higher expected activity. Note that CRISPR sites with ambiguous bases will have an undefined score and be colored blue.
Doench et al. (2016) also accounts for the sgRNA location within a protein sequence, melting temperatures of features of the sgRNA and the sgRNA sequence as a whole, and counts of single and dinucleotides in a position-independent manner. Scores are between 0 and 1, with a higher score denoting higher expected activity. CRISPR sites with ambiguous bases will have an undefined score and be colored blue. The Doench et al. (2016) algorithm requires python to run; on Windows this will install automatically the first time that the scoring algorithm is used, and on mac and linux the system installation of python will be used (python 2.7 or 3.6-3.9 is required).
Specificity Scoring
Use these options to score your CRISPR sites based on how unique they are and how likely they are to cause off-target effects. Scores are between 0 and 100, with a higher score denoting better specificity and less off-target activity.
When finding CRISPR sites within a Selected region of your sequence, Geneious will check for off-target interactions in the unselected regions of your sequence. If Score against an off-target database is selected, Geneious will also search sequence documents in the selected folder for off-target interactions. While doing so, Geneious will skip any sequences in the off-target database that are exact duplicates of the target sequence, and report the intervals it skipped at the end of the operation.
Use Maximum mismatches allowed against off-targets and Maximum mismatches allowed to be indels to tailor how similar off-target sites must be to the CRISPR site before they contribute to the score.
If multiple sequences are given as the targets, the option to Score each sequence against all other selected sequences is available. This checks for off-target interactions between the target sequences and incorporates them into the off-target scores.
The scoring algorithm for CRISPR sites with 3′ PAMs was proposed by Zhang et al. (2013). Mismatched bases between the CRISPR site and off-target sites have different weightings in the final score, which are experimentally determined and based on their position. Geneious also recognizes a 10 bp seed region immediately next to the PAM, which can tolerate a maximum of 2 mismatches (Cho et al. (2014)).
For CRISPR sites with 5′ PAMs, a modified version of the Zhang et al. (2013) algorithm is used. Geneious recognizes a 6 bp seed region next to the PAM, which tolerates up to 2 mismatches and has a high mismatch weighting in the score. From position 7 to 18, mismatches have an average weighting, and after position 18, mismatches do not contribute to the Specificity score. These weightings were not experimentally determined and were chosen to give a similar score spread to the Zhang et al. (2013) method. See Kim et al. (2016) and Kleinstiver et al. (2016) for details on the seed, trunk, and non-weighted regions used.
Scoring against an off-target database will significantly increase the time taken for the operation to complete.
Pair CRISPR sites
The Cas9 D10 Nickase enzyme induces a single stranded break at the target instead of the usual double stranded break. This enzyme can be used with a pair of CRISPR sites on complementary strands to induce a double stranded break with sticky ends. This method also minimises off-target effects because any that occur are single-stranded, and therefore repaired by the cell with high fidelity. This process is described by Zhang et al. (2013).
Select Pair CRISPR sites to only return guides that are within range of another guide on the opposite strand. You can specify the Maximum overlap of paired sites and the Maximum allowed space between the paired sites, which are measured from the 5′ end of the CRISPR sites. Optimal CRISPR pairs will be linked when they are annotated onto your target sequence.
Results output
CRISPR sites are returned as annotations on your original sequences.
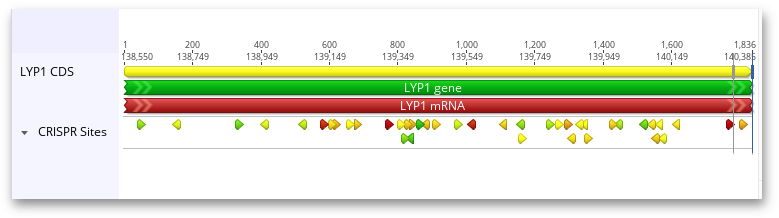
Hovering the mouse over one of these annotations will bring up a tooltip about the CRISPR site: its Target Sequence, PAM (Protospacer Adjacent Motif), and any scores that were calculated for the CRISPR site. If the CRISPR sites were scored through off-target analysis, the five most similar off-target sites are also included in the annotation. Mismatches between the CRISPR site and its off-target sites are highlighted in red, and insertions in the off-target site are red and underlined.
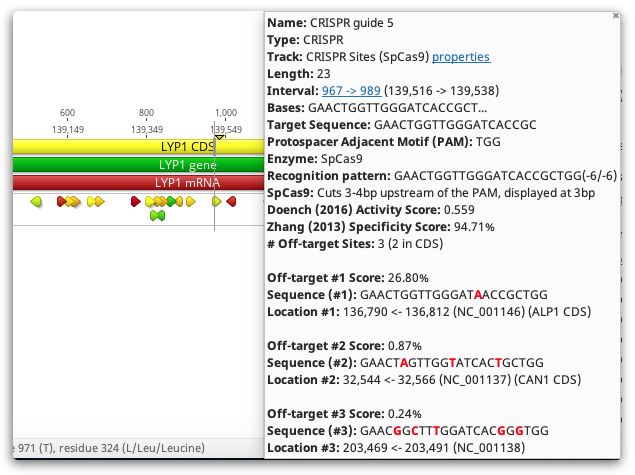
CRISPR site annotations can also be colored by their scores. Choose the score to color by using the Color CRISPR sites by option. You can change which score is used for coloring later by selecting Color by / heatmap in the annotation Track options. The colors move from green, for good scores, through yellow, and down into red, for poor scores.
Analyze CRISPR Editing Results
To analyze the results of your CRISPR editing experiment, go to Annotate and Predict → Analyze CRISPR Editing Results. This operation measures the frequency of variants around the CRISPR editing site by mapping reads to the target sequence. Mapped reads are collapsed into clusters based on their difference from the reference and the frequency of each cluster is reported in the alignment (see Algorithm Overview for more details).
This operation is designed for amplicon sequences produced from either Sanger or NGS sequencing. Sequences must be in a sequence list, and paired reads should be merged via menu Sequence → Merge Paired Reads prior to running this operation.
Operation options
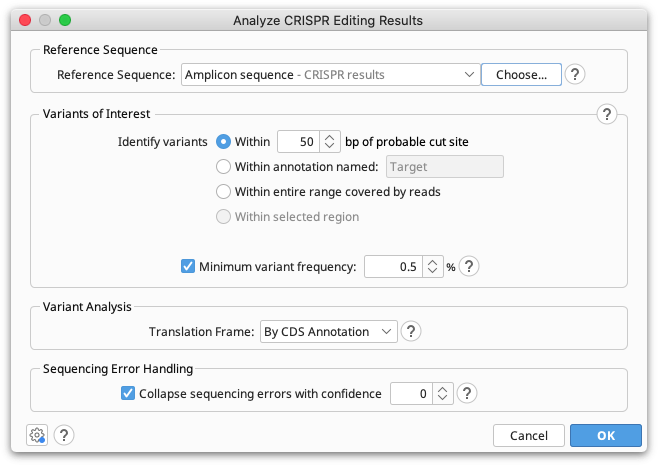
Reference Sequence
The reference sequence should be a short sequence spanning the CRISPR editing site, of similar length to the reads. This sequence is normally the unedited, or target sequence for calling variants against. The reference sequence can be selected together with the reads prior to opening the operation, or can be set from the operation dialog.
Workflows: The reference sequence option is not available from workflows. If this operation is included in a workflow, the reference sequence must be provided as input to the workflow. Or you can insert it into the workflow using the 'Add document chosen when running workflow' option.
Variants of Interest
Only the portion of each read which spans the specified region of interest will be used for variant calling. This region can be either a specified number of bases around the probable cut site (default 50bp), the region currently selected in the sequence viewer, or the entire range covered by the reads.
Reads will be entirely excluded from variant calling if they match poorly on the ends of the reference sequence range matched by 99% of reads. See the algorithm overview for details.
Minimum Variant Frequency
The minimum variant frequency setting is used to exclude low frequency variants from the results displayed. Note that this setting does not change the reported frequencies of variants, i.e. the frequencies will be a percentage of both included and excluded variants.
Translation Frame
The translation frame is used for calculating variant effects on the protein. The genetic code is obtained from the reference sequence properties which can be set in the Info tab or Sequence View.
Sequencing Error Handling
Most of the time we can have reasonable confidence whether or not a rare variant is likely due to sequencing error and either correctly collapse it into the cluster it belongs to or correctly keep it separate. The setting Collapse sequencing errors with confidence controls what to do in borderline cases.
-
If this value is 0, then reads will be collapsed (combined into a single cluster) if there is greater than a 50% chance the variant is due to a sequencing error.
-
A positive value for this setting will err on the side of not collapsing reads so that true rare variants are unlikely to be excluded from the final results.
-
A negative value for this setting will err on the side of collapsing reads so that variants which are not real are unlikely to appear in the final results.
The value is log scale, so a value of +10 (or -10) means reads are collapsed (or not collapsed) with 90% confidence it is correct to do so, ± 20 means 99% confidence, ± 30 means 99.9% confidence.
Turning off this setting is equivalent to using a large positive value. For sequencing reads without Phred quality scores, each base is assumed to have quality score of 20 (99% confidence)
Results display
The CRISPR editing analysis tool produces an assembly document showing one representative of each cluster mapped to the reference sequence. The frequency of the variant, and its effect (either No nucleotide variant, Frame shift, In frame stop codon, In frame protein variant, or In frame silent variant) are shown in the sequence name. A summary of these results can also be viewed in the assembly description and the Info tab.
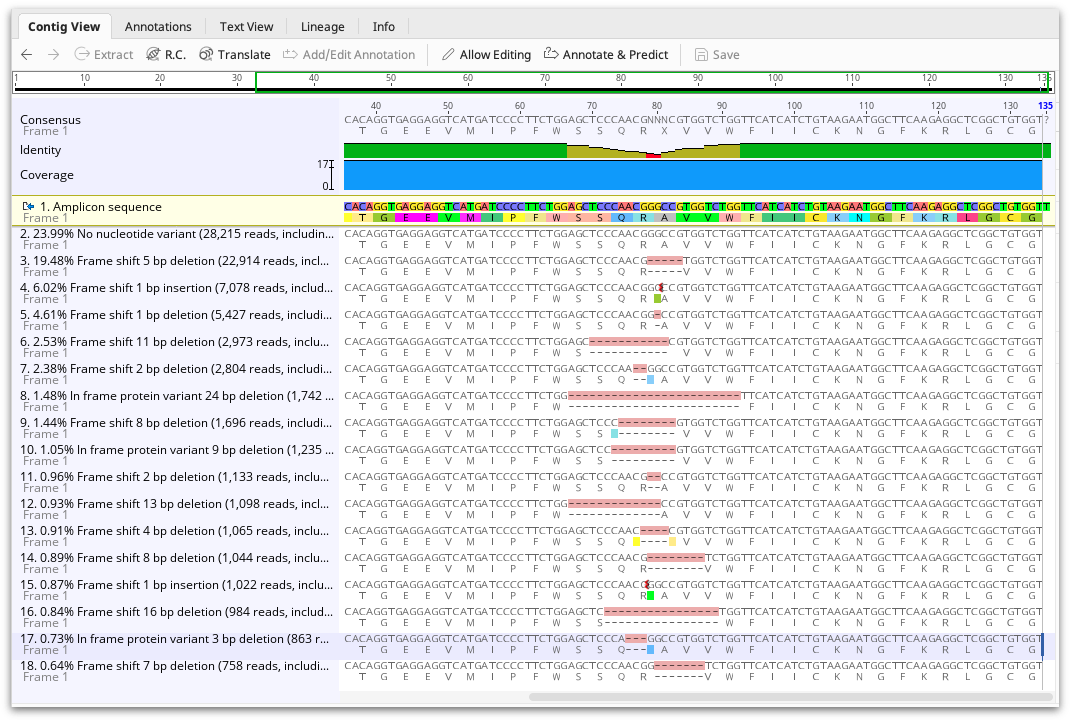
Each variant is also annotated on the mapped read, but annotations are turned off by default. To view the annotations, go to the Annotations and Tracks tab to the right of the viewer and turn on the variant annotations. The annotations contain the same information as the Info tab, such as variant effect and frequency. Using the annotations table, this information can be exported in tabular format.
Algorithm Overview
-
A range within the reference sequence is identified by mapping all reads to the reference sequence and trimming them such that no more than 2 out of 10 bp at either end mismatch. They are then further trimmed to ensure that no more than 50% of bases of shorter lengths mismatch. This is to filter out primers on the ends of sequences. The range of the reference sequence used is that which is covered by 99% of the trimmed reads which map.
-
Untrimmed Reads which have more than 2 mismatches out of 10 bp at either end of this reference sequence range are discarded. This is to ensure that reads which are very poor quality on either end (and therefore not true variants from the reference sequence) do not interfere with variant calling.
-
If the variants region of interest in the options specifies to use a region within a specified number of bp of the cut site, the region of interest is calculated as follows
-
Reads are sampled randomly, taking the intersection of the range of variants within those reads until it converges to a small range.
-
Repeat the above step 100 times.
-
The ranges converged on are sorted by decreasing frequency.
-
Take the union of the most frequent ranges until that covers 1/6 of the region of interest size, but also include ranges with frequency over 1/5 of the highest frequency as long as the combined range does not exceed 3/4 of the region of interest size.
-
The full region of interest is centered on this range.
-
-
Read alignments are trimmed to the region of interest, and collapsed into identical clusters. This means that reads which only differ from each other outside of the region of interest will be considered identical.
-
Clusters are sorted by decreasing frequency, and lower frequency clusters are merged into higher frequency clusters if it is likely the lower frequency cluster came from the higher frequency cluster due to sequencing error. Only substitution errors are considered during this merging process. Indel sequencing errors are never collapsed.