Microsatellite Analysis
The Microsatellites Plugin imports ABI fragment analysis files and allows you to visualize traces, fit ladders, call peaks, predict bins, display alleles in tabular format and export your data for further analysis. To install the plugin, go to Tools → Plugins, select it from the list of available plugins and click **Install. **
The Geneious Microsatellite Plugin is intended for research purposes only and has not undergone validation for human identification analysis or diagnostic procedures.
Importing your Data
Once you have the plugin installed, simply select the .fsa files you want to import and drag them into Geneious. The importer will automatically recognize them and store them as Geneious documents, which you can then select to visualise and analyse your data.
Viewing traces
The controls to the right of the viewer allow you to zoom in and out on the traces, control which dyes are displayed, and view peak labels, peak calls and bins. If multiple traces are selected, they will be stacked in the viewer in the same order they appear in the document table.
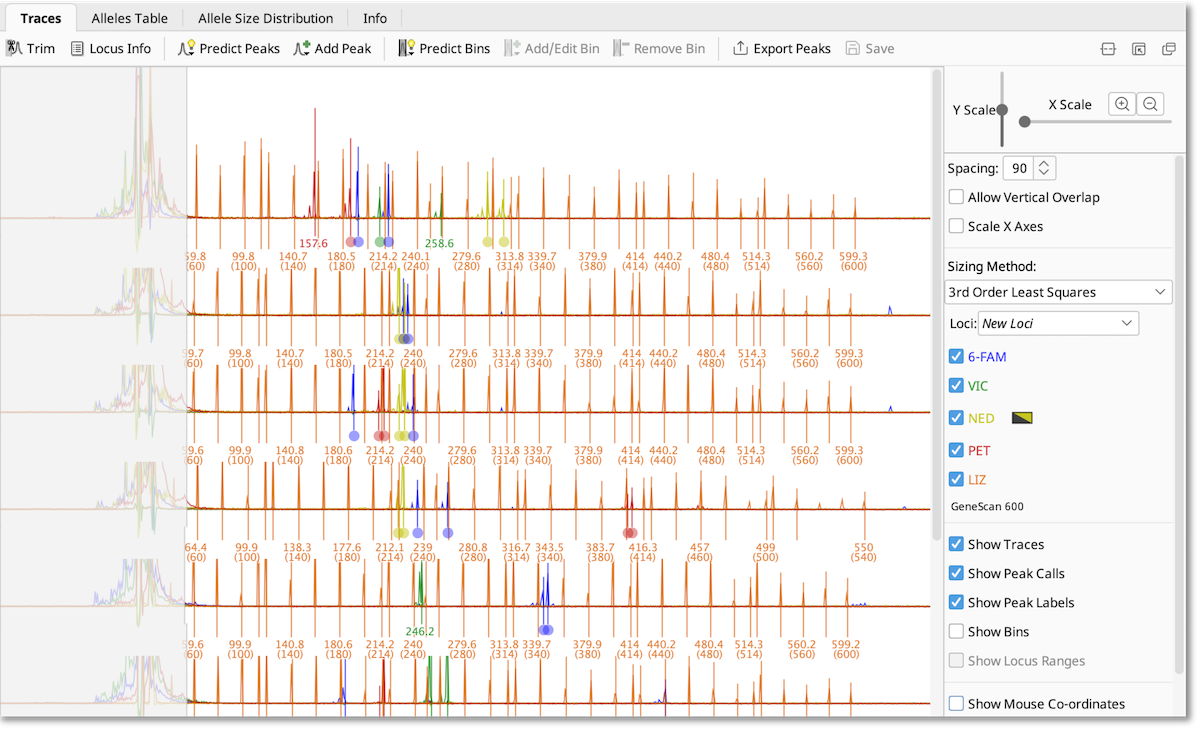
The viewer controls are as follows:
- Y Scale - Adjusts the vertical amplitude of the traces
- X Scale and Zoom buttons - Adjusts the X axes zoom
- Spacing - Adjusts the vertical separation between rows. This option is not available when viewing a single document.
- Allow Vertical Overlap - Allows traces from different documents to overlap vertically, disabling this option often gives better drawing performance. This option is not available when viewing a single document.
- Scale X Axes - Whether to use raw coordinates from the electropherogram machine on the x axes or to scale them into base pair (nucleotide) coordinates. This option is not available when viewing a single document.
- Sizing Method - The method that is used to do the sizing conversion from raw machine coordinates to base pairs
- Loci - The document that provides the locus information and bins
- Trace buttons - Show or hide drawing of specific trace dyes. Note: the yellow dye can be switched to black for enhanced visibility
- Show Traces - Toggles drawing trace lines
- Show Peak calls - Toggles drawing peak calls
- Show Peak Labels - Toggles drawing peak call labels
- Show Bins - Toggles drawing bins
- Show Locus Ranges - Toggles drawing the size ranges of the allele regions. Note: this is only enabled when viewing a single microsatellite dye.
- Show Mouse Co-ordinates - Show the mouse X coordinate in base pair units and the amplitude of the largest trace under the cursor in relative fluorescence units (RFU)
- Show Document Names - Toggle showing the document names on the left
- Show Y Axes Scale - Toggle showing a Y axis scale for traces on the left in relative fluorescence units (RFU)
Analyzing your data
To analyze your microsatellites, the following steps should be performed:
- Ladder calling
- Setting up locus information
- Checking peak calls
- Predicting bins
Each of these steps is described in more detail in the sections below.
Ladder calling
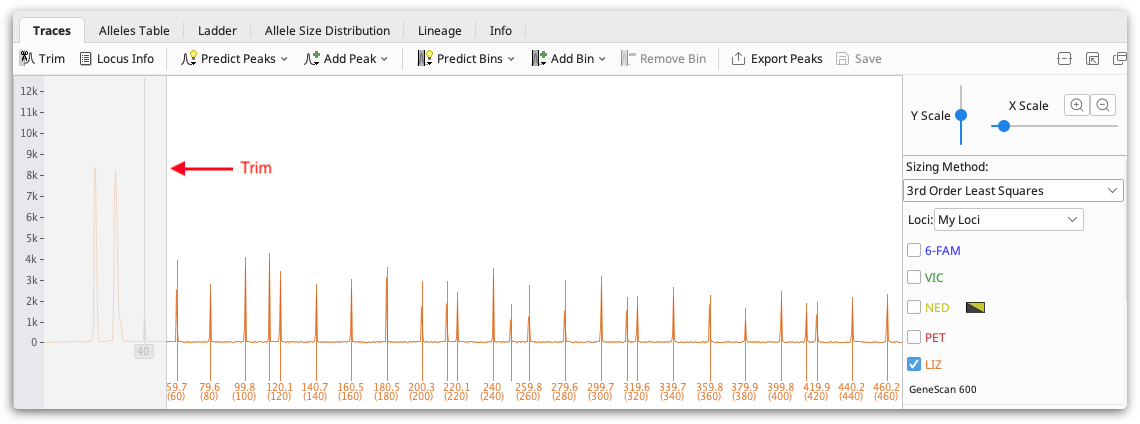
Geneious will automatically fit the ladder based on the peaks in the last dye (normally LIZ) of your trace (ladders that are not in the last dye will not be recognised). Geneious uses the distance between ladder peaks to determine which ladder you have used.
To ensure your ladder is accurately called, check that the Trim on your traces is set appropriately and that the correct peaks are called in the ladder. The trim is greyed out area at the start of each trace which represents the area of noise around fragment length 0-50bp that should be ignored. You can set this using the Trim button above the viewer, or you can set it per document by dragging the right hand edge of the trim, or if there is no trim visible just drag from the far left of the trace window to create one.
If additional peaks are called in your ladder, or some peaks are missed, select the peaks and use Add Peak or Remove Peak (buttons above the viewer) to add or remove peaks as required.
This post provides more information on what to do if Geneious doesn’t recognise your ladder.
Sizing Methods
At this stage you should also set your sizing method - this is the algorithm used to convert x coordinates from the trace into base pairs. 3rd Order Least Squares or Local Southern are the recommended algorithms.
The least squares algorithms fit a first, second (quadratic) and third (cubic) order polynomial function to the all ladder peaks. These functions are able to convert between sizes that are outside the range of the ladder and are hence known as global functions. On the other hand the "Two Surrounding Peaks", "Local Southern" and "Cubic Spline" methods require a certain number of peaks on each side of the microsatellite peak in order to size it and are hence known as local methods. The "Two Surrounding Peaks" method simply estimates the peak size from the ladder peaks on either side. The "Cubic Spline" method fits a series of cubic functions between the ladder peaks and also requires a ladder fragment peak above and below, and the "Local Southern" method takes the average of two curves as described by E.M. Southern in http://www.ncbi.nlm.nih.gov/pubmed/525781 and hence requires two ladder peaks above and below.
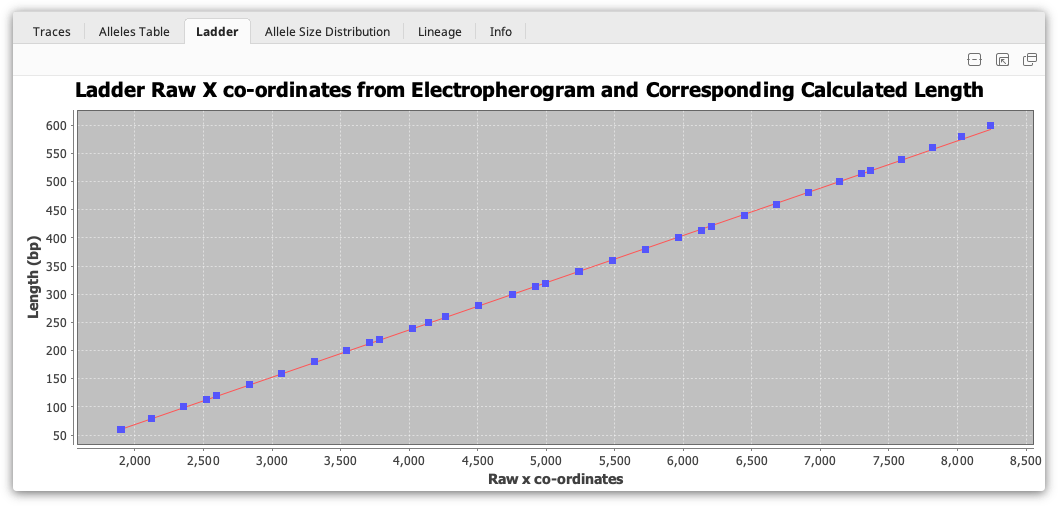
Ladder viewer
The ladder viewer is only available when viewing a single document and only works when a ladder is fitted. It displays a graph showing the raw X coordinates from the electropherogram machine and the corresponding matched length in base pairs for the ladder fragments. A line of best fit is plotted which corresponds to the selected sizing method.
Adding a custom ladder
Microsatellite ladders are stored in a text file which can be manually edited to add new ladders.
This file can be found in the Geneious plugin installation directory. The location of this varies by computer operating system and permissions, the easiest way to find it is search the filesystem for the following directory name:
com.biomatters.plugins.microsatellite.MicrosatellitePlugin (Mac or PC)
or com.biomatters.plugins.microsats.MicrosatsPlugin (Linux)
Within this directory are a series of sub-directories
com/biomatters/plugins/microsatellite/data
and within this directory is a ladders.txt file.
This file contains a tab-separated list of ladders where the first field is the name of the ladder and the rest are the ladder fragment peak sizes in bp. Geneious must be restarted for changes to this file to take effect.
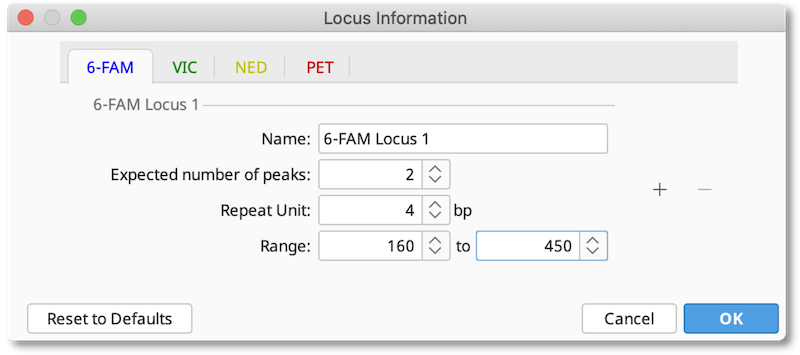
Setting up locus information
The Locus Document is created by clicking the Locus Info button and entering the details of the expected loci for each dye, including the expected number of peaks, repeat unit size and expected allele size range. If you are working on a diploid organism, the expected number of peaks should be 2. For polyploid organisms you can increase this number to the number of homologous chromosomes your organism has.
After this information is saved, a Locus Document will appear in your folder. This information will be used for whatever documents you had selected when the locus document was created.
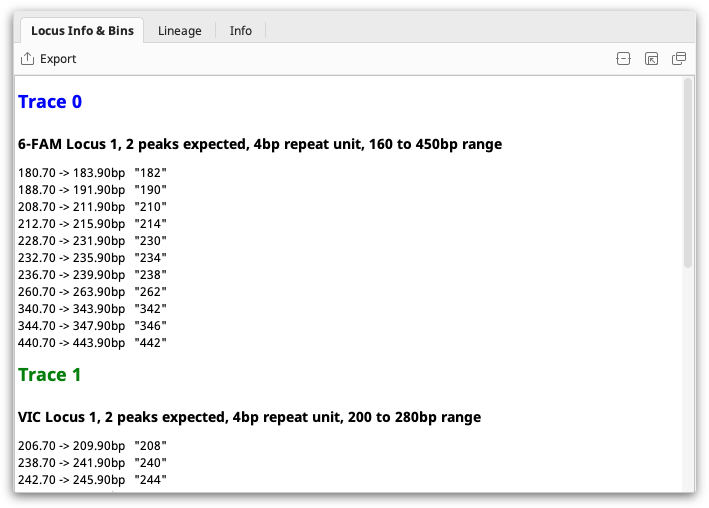
You can select a single locus document to view the information it contains.
If you select a locus document along with some Trace Documents, Geneious will use it as the Locus Information for those traces, prompting you if you have previously been using a different Locus Document with those files.
To change the locus document used for a selected trace, click the Loci: dropdown menu to the right of the viewer.
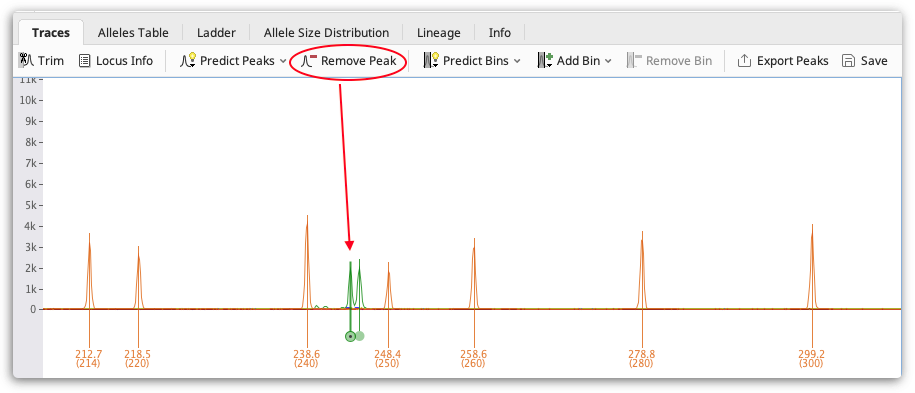
Checking Peak Calls
Check your traces for any stutter peaks or incorrectly called peaks and remove them using the Remove Peak button above the viewer. To select a peak to remove click on it. Multiple peaks can be selected by holding the CTRL key (Command on Mac OS) and/or clicking and dragging to select all peaks in a region.
You can also manually add a peak call by clicking a point on a trace and clicking Add Peak. You can hold the CTRL key (-Command on Mac OS) and click to select multiple points. You can also add peaks by right clicking.
If you wish to manually re-run peak calling at any time, select Predict Peaks. This re-runs the automated peak calling algorithms and allows setting the minimum height threshold in RFU below which peaks will not be called. When data that could lead to a change in peak calls (e.g. trim, ladder peaks) is changed these are run automatically until manual changes are made by the user, at which point they stop in order to not overwrite the user's changes. This option allows re-running them in this case.
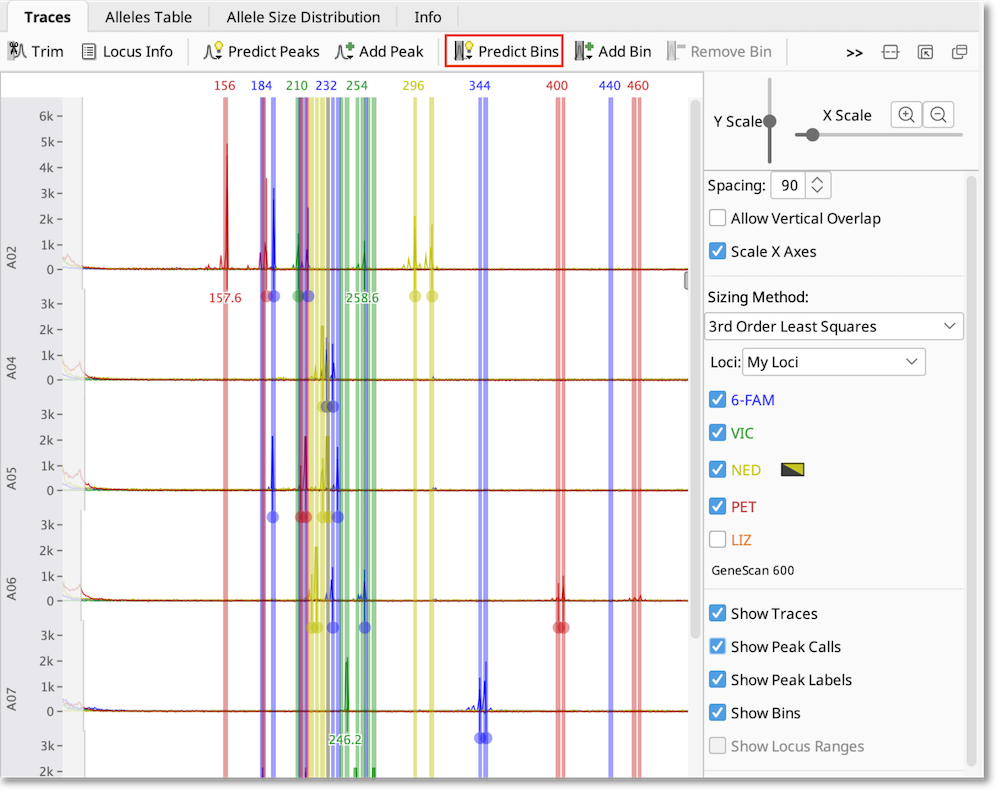
Predicting bins
To create bins based on the size of the observed peaks, select all of the traces you want to analyze, click Predict Bins and select each dye you have used. If you wish, you can specify an “example allele” to anchor the bin to. Binning sorts the peaks into allele sizes based on the repeat unit information you’ve provided in the locus document, allowing you to account for small variations between samples.
If you wish to adjust the bins, use the buttons above the viewer Add/Edit Bin and Remove Bin.
Viewing results
Select the Alleles Table to view your alleles in tabular format. The alleles table shows the binned allele size for each allele, or a warning if there are no peaks or peaks falling outside the bins.
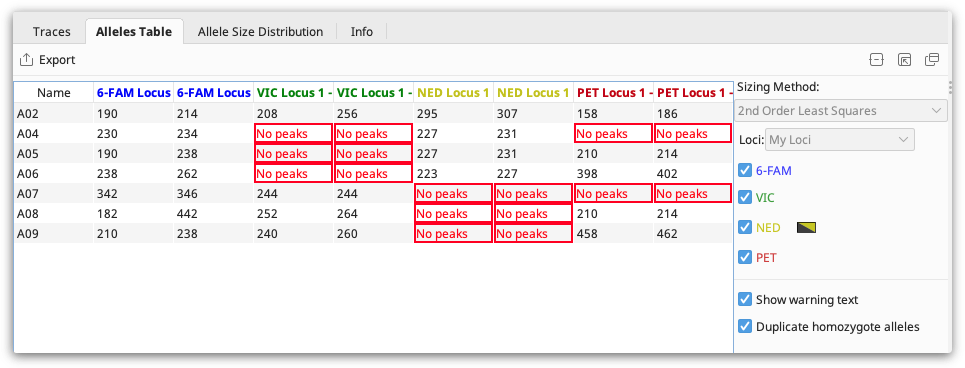
The “no peaks” warning generally means that no product was amplified in that sample.
If you have unbinned peaks that are just outside the bin boundary, go to the affected trace document and turn on just the dye that has the unbinned peak. Select the bin the peak should be in and choose Edit Bin and extend the range, or just drag the bin to include the peak. If a peak is well outside the bin boundary you may need to consider whether the peak is called correctly.
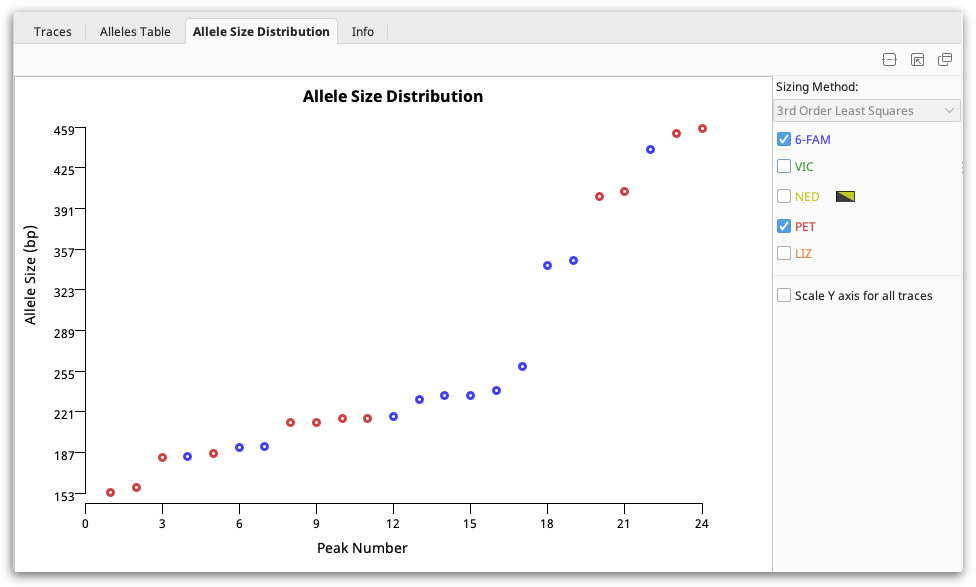
Allele size distribution viewer
This viewer displays the allele sizes for all peaks in the selected documents and dyes sorted by ascending size. Once peaks are correctly sized alleles should be clearly visible as steps as in the figure below:
Exporting your data
When you are happy with your allele calls, you can export the Alleles table in .csv format by clicking the Export table button.
You can also export the calculated peak sizes in base pairs (nucleotides) using the Export Peaks button above the viewer. This exports peak sizes as a comma separted values (CSV) file for import into other programs, such as Microsoft Excel. It does not export peak heights.